This news concerns administrators from company accounts with at least two users.
To enable your users to log in to portatour® with your company’s Microsoft account, two steps are necessary: Setting up Microsoft as a single sign-on provider in portatour® and assigning Microsoft users to portatour® users.
Setting up Microsoft as a single sign-on provider
- Go to “Workspace Organization” and open “Options”.
- In the “Security” section, click on “Single Sign-on Provider > Add > Microsoft”. The following window appears:
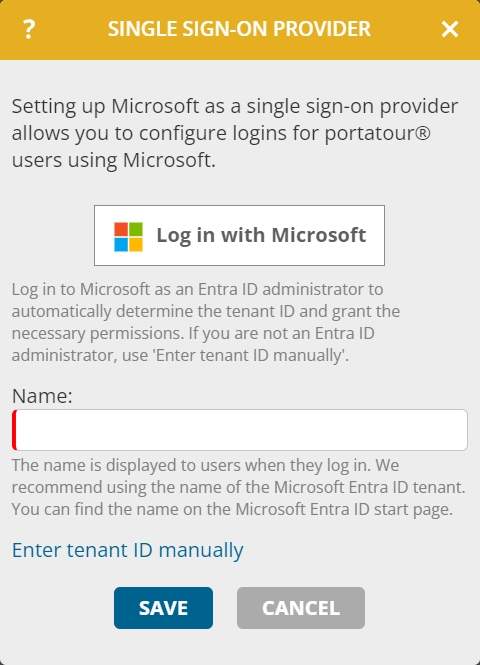
- Are you yourself Entra ID administrator of your Microsoft client?
- If yes:
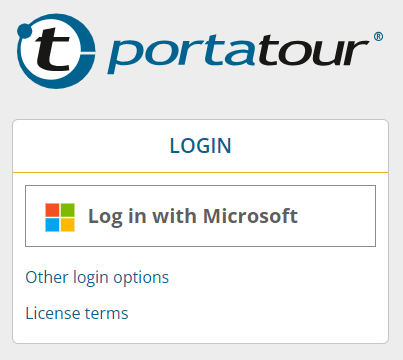
- Click on “Log in with Microsoft”.
- Log in with your Microsoft account.
- Confirm the requested permissions with “Accept”.
- If no:
- Click on “Enter tenant ID manually”.
- Click on “Copy link” and share it with your Entra ID administrator to install the “portatour® single sign-on” enterprise application and to accept the requested permissions. During this process, your administrator will receive the tenant ID.
- Enter the provided tenant ID.
- Enter the name of your Microsoft client in the “Name” field. Typically, this is your company name. No verification takes place. The name helps you and your users to identify the correct Microsoft account if you have several Microsoft clients.
- Click “Save”.
Assigning Microsoft users to portatour® users
You have four options for assigning Microsoft users to portatour® users: By means of individual invitation emails, by means of mass invitation emails, by means of manual entry of the Microsoft object IDs or by importing the Microsoft object IDs.
Assignment by invitation e-mail
- Go to “Workspace Organization” and open the menu item “Users”.
- Click on the desired user to open the detailed view of this user.
- Click on “Send invitation” in the “Log in with SSO with Microsoft” section.
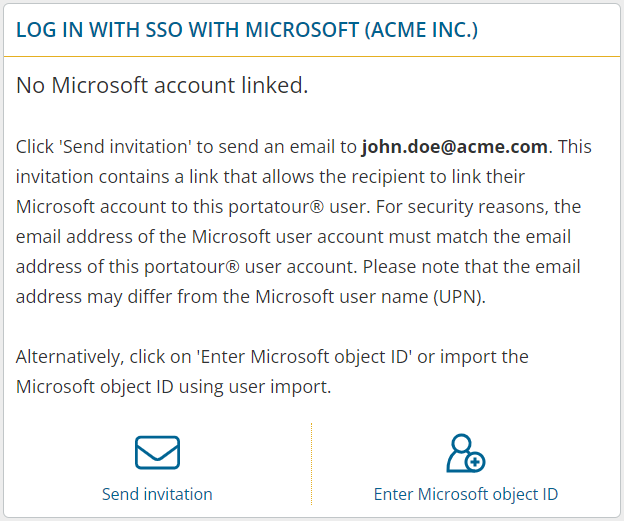
- The user receives an email with an invitation link. This invitation link is valid for 30 days.
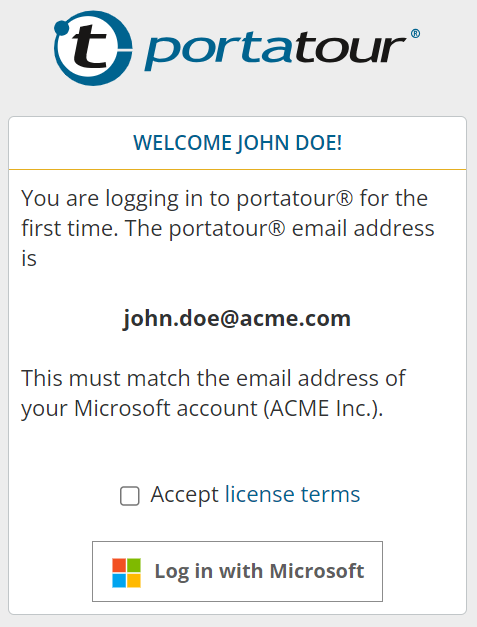
- After clicking on the invitation link, the user logs in to their Microsoft account.
- After logging in, the assignment is successfully created. You can recognize this if the Microsoft user name (UPN) is also displayed on the user’s detail page.
Notes:
- For security reasons, the email address of the Microsoft user must match that of the portatour® user for the assignment invitation to work. After a successful assignment, the email addresses on both sides can be changed without affecting the assignment.
- To invalidate an invitation prematurely, click on the recycle bin symbol.
- To send a new invitation, click on “Send new invitation”. The original invitation will then become invalid.
Assignment by means of mass invitation e-mails
- Go to “Workspace Organization” and open the menu item “Users”.
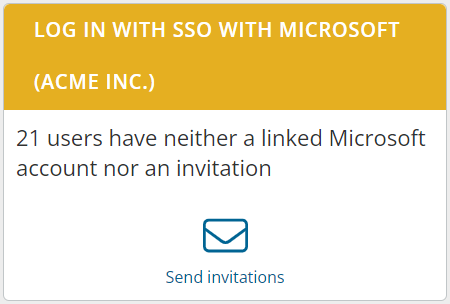
- At the end of the user list, click on “Edit all X”.
- In the column “Log in with SSO with Microsoft” in the section “X users have neither a linked Microsoft account nor an invitation”, click on “Send invitations”.
Notes:
- In the user list, use the selection mode or the extended search to specifically restrict the users affected by this process.
- The instructions for the individual invitation email apply analogously here.
Assignment by entering the Microsoft object ID
For this procedure, you must know the user’s Microsoft object ID. As administrator of your Microsoft client, you will find this in the user management of the Microsoft Entra Admin Center.
- Go to “Workspace Organization” and open the menu item “Users”.
- Click on the desired user to open their detailed view.
- Click on “Enter Microsoft object ID” in the “Log in with SSO with Microsoft” section
- Enter the Microsoft object ID of the user – preferably using Copy & Paste from the Microsoft Entra Admin Center.
- Click “Save”.
- The user can then immediately log in to portatour® using SSO.
- Optionally, click on “Send access link” so that the user receives the link to the SSO login page of portatour® via email.
- You can recognize a successful login by the user if the Microsoft user name (UPN) is also displayed on user’s detail page.
Notes:
- Proceed carefully. When entering the Microsoft object ID, there is no check whether the user exists in your Microsoft client or whether it is the desired user.
- In this case, it is not necessary for the email addresses of the user in portatour® and Microsoft to match.
Assignment by importing the Microsoft object IDs
If you have the Microsoft object IDs of your users as a file, use the user import to assign them to existing or new users.
In the import wizard, assign the corresponding column in your file to the “SSO Microsoft object IDs” field and then carry out the import in the usual way.
Notes:
- The instructions for entering the Microsoft object ID apply analogously here.
- If the “SSO Microsoft object IDs” field is missing, you have not yet set up Microsoft as a SSO provider in portatour®.
- The name of the field also contains the name of the SSO provider you have specified.
- If you want to assign several Microsoft users to one portatour® user, separate the object IDs with a semicolon ‘;’.
Deactivating single sign-on
Automatic blocking of a user
If a user is blocked or deleted by the SSO provider, the assigned user in portatour® can no longer log in via SSO after one hour at the latest. You do not need to do anything in portatour®. If the user was already logged in via SSO, they will be automatically logged out.
Remove SSO login for a user
If you no longer want to allow SSO logins for a specific user, click on the corresponding recycle bin icon on the user’s detail page to delete the SSO-assignment. Alternatively, remove the Microsoft object ID from the corresponding line at the user import.
Deactivating or deleting a SSO provider
If you want to disable login with SSO for all users, deactivate the corresponding single sign-on provider in the organization options.
You can then also delete the SSO provider. All SSO assignments of the users will be deleted.
Other notes on single sign-on
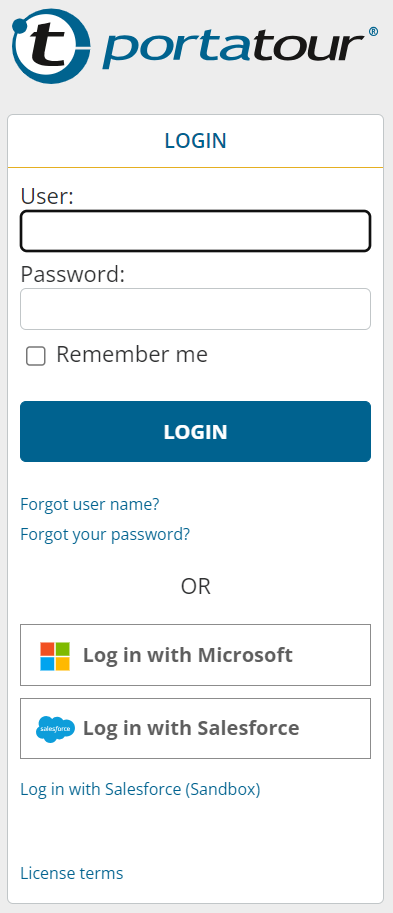
SSO login and login with user name & password
portatour® allows users to log in with both user name & password and SSO. If you introduce SSO, this is done for existing users without interruption and without the need for strict timing.
You can see both login options for a user in the user list. Manage them at the user’s detail view or via mass editing of users.
Deactivating login with user name & password
If you have successfully introduced SSO, you can deactivate the login via user name & password if desired.
In a user’s detail view, click on “Disable login” in the “Log in with user name & password” section.
Alternatively, use the mass editing in the user list. In any case, make sure beforehand that the affected users have already successfully logged in with SSO, e.g. by using “Search > Extended > Linked SSO accounts > possible (link to account used)”.
Multiple SSO providers
portatour® allows you to set up multiple SSO providers. This supports the following scenarios, among others:
- Users from different organizations (countries, subcontractors, internal/external) work in portatour®, whereby each organization is managed in a separate Microsoft client.
- You want to change the SSO provider. The transition is seamless for users, as both providers work in parallel.
Assign a unique name to each SSO provider. In the user detail view and in user mass editing, the respective SSO providers can be found in their own sections, in user export/import in their own columns.
Multiple SSO assignments per user
Several SSO assignments can be stored at a user in portatour®. This is useful for the SSO provider change scenario mentioned above.
Different portatour® users can also be assigned to the same user of a SSO provider. The portatour® user may also be located in different portatour® company accounts. In such cases, the user is prompted after the SSO login to select the desired portatour® user with which they wish to continue working.
This is helpful, for example, in a scenario where an administrator manages several portatour® company accounts and therefore has a separate account in each portatour® company account.
SSO in conjunction with Microsoft Dynamics CRM
If you use Microsoft Dynamics CRM as your data source system, SSO is not yet possible. We are already working on an update to support SSO.