For several years now, portatour® has been using historical speed data for the calculation of driving times. This data is collected by navigation systems and mobile phone providers by measuring the movement data of millions of road users and is provided for respective road sections. Road sections where the traffic flow data often shows congestion or slow traffic are either avoided or planned with longer travel times when calculating schedules. Traffic flow data is updated in portatour® on a quarterly basis.
What’s new with this update is that you can now display the affected street segments as follows:
- Open the map.
- In the top right corner, click the cogwheel icon.
- Set the “Traffic” selection box to “Traffic: Typical for work days”.
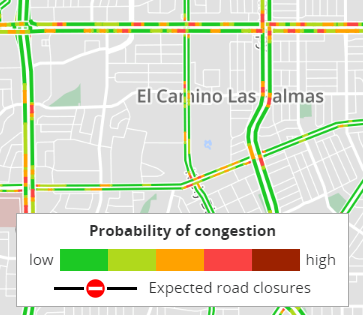
Roads that are shown in red have a high probability of congestion on work days and are therefore evaluated judiciously when planning travel times.
Reminder: In the Options under “Driving Speed” you can further influence driving time. More about this in the online help.