This news concerns administrators and supervisors of company accounts with activated territory optimization.
The new display modes are available in every map of territory optimization and are suitable tools if you prefer manual optimization of areas instead of automatic optimization.
Click on the cogwheel at the top right. In the selection field “Display” you will find three new entries: beeline, distance zones and driving routes.
Note: In these display modes, the customers are automatically hidden so as not to cover the lines. To additionally show the customers, click on “customers: Show all” on the cogwheel.
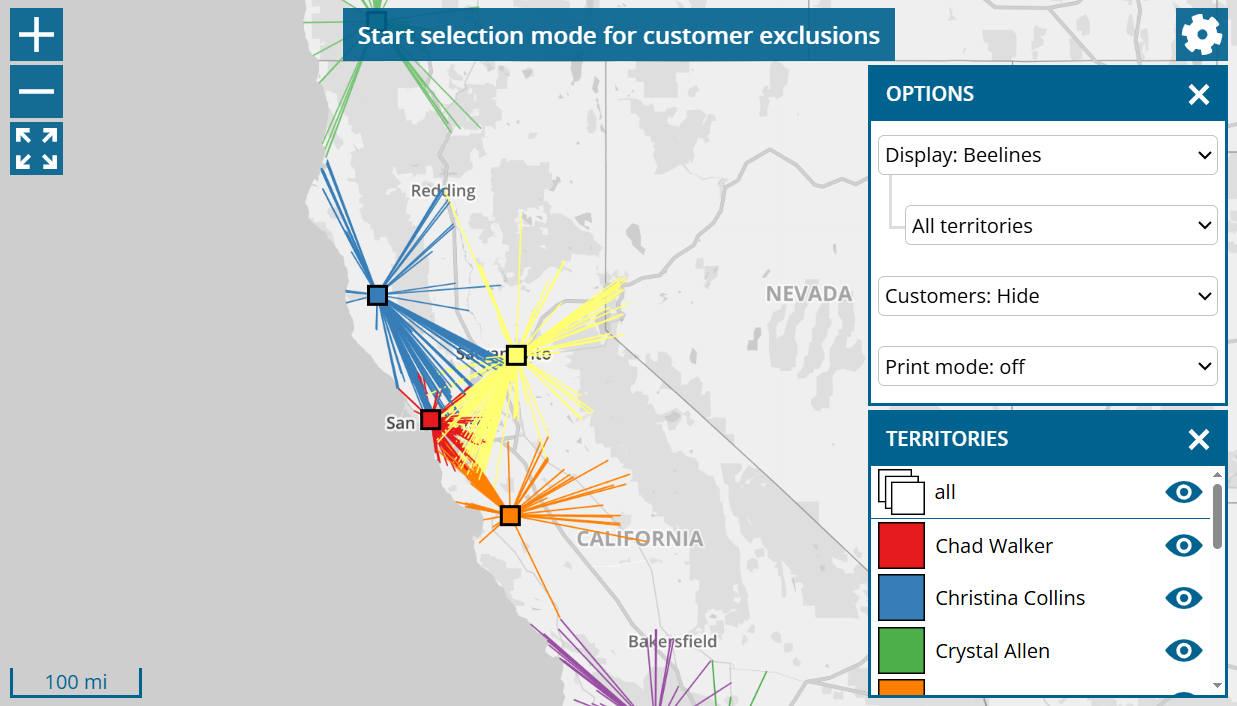
Beeline
For each employee, direct connecting lines are drawn between home location and all of its customers.
An intersection with the lines of another area can be an indication that customer assignment is in need of improvement. However, we recommend using the more modern route display to analyze the situation correctly.
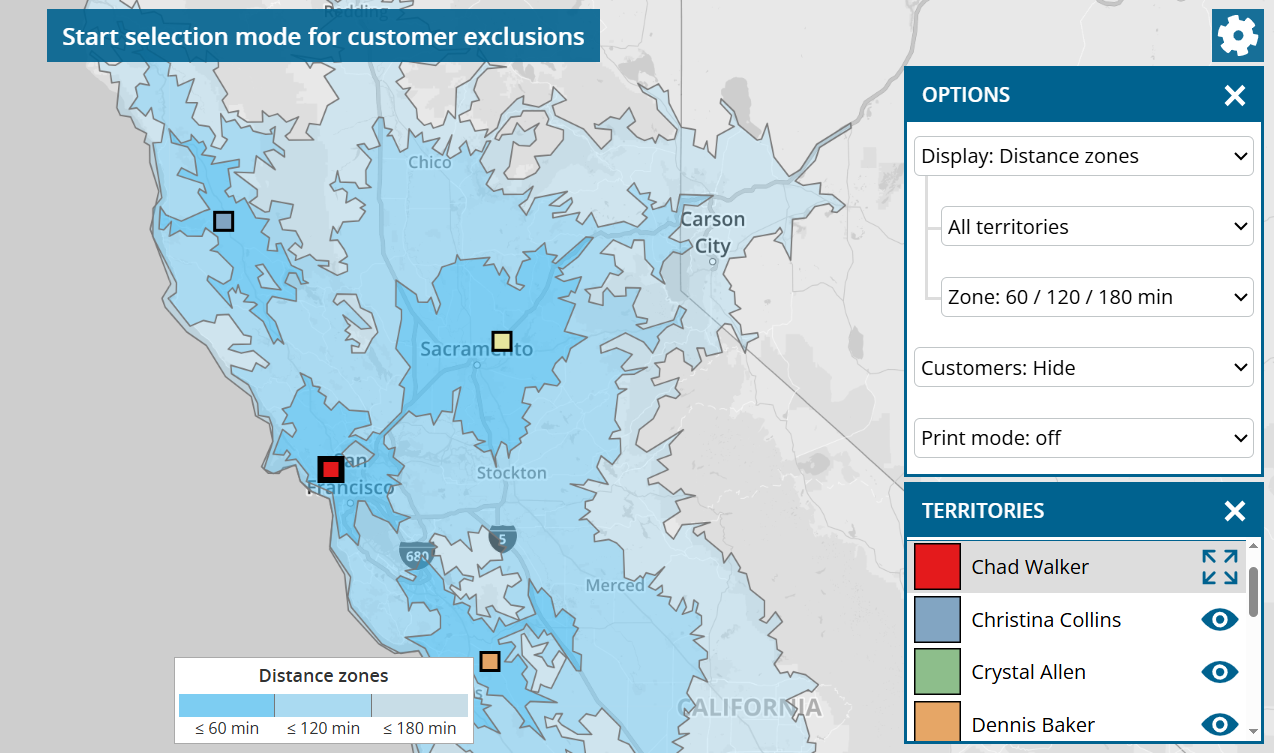
Distance zones
The distance zones provides information on how long your employees have to travel to reach the individual regions of your sales area.
Light or non-colored regions indicate that the support of customers is associated with more driving time there. However, to analyze the situation correctly, we recommend color of customers after driving time.
By default, the system is divided into the following three zones, which are displayed in different shades of blue: up to 60 minutes driving time, up to 120 minutes driving time and up to 180 minutes driving time. To change the distance zones, use the “zone” selection box by the cogwheel.
The distance zone for a region is determined based on the nearest employee. If you only want to determine the distance zones based on one employee, switch from “All territories” to the desired region.
Routes
In “Routes” display mode, there are two options for Selection: “Routes from home location” and “Typical routes“.
Due to the complexity of the calculation, this display cannot be performed simultaneously for all territories. Select the area to be analyzed using the cogwheel.
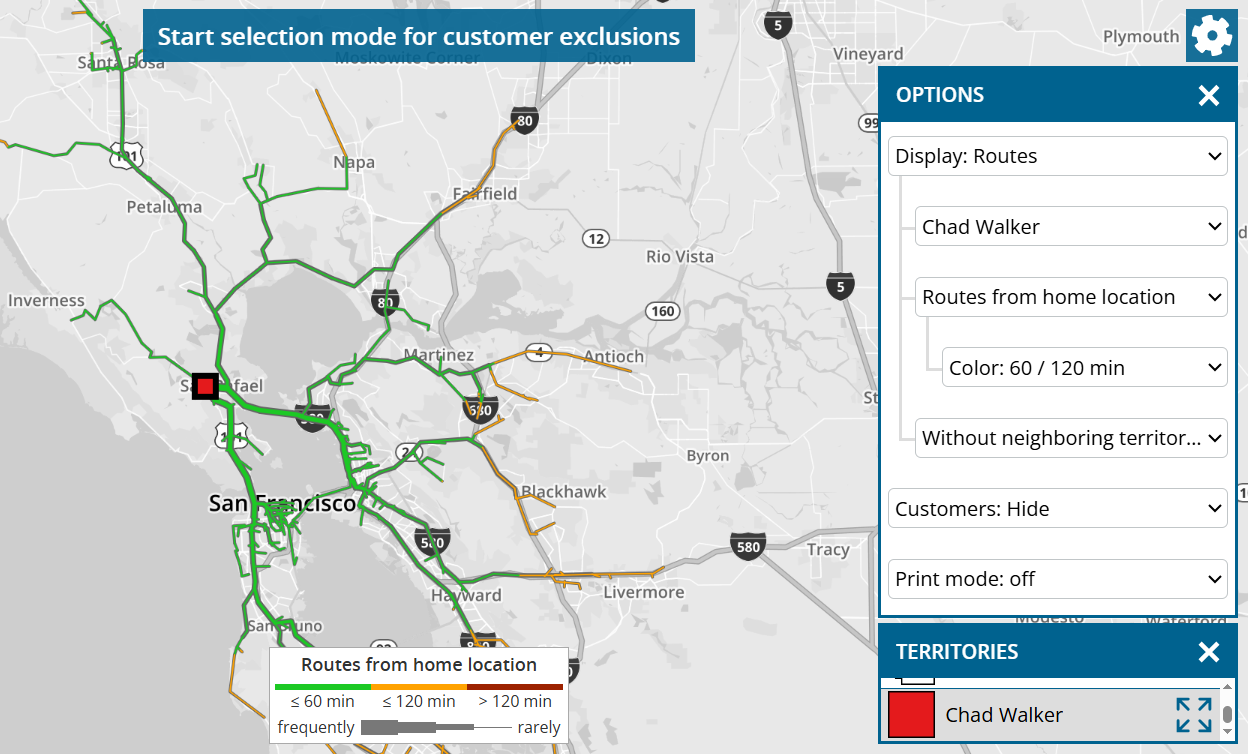
Routes from home location
All routes are displayed, which the employee must drive from his home location in order to reach each of his customers, which has entered a call interval, directly in the fastest way.
The green/orange/red color of driving distance indicates how long it takes to get there. You can use the cogwheel to change the limits for this color.
The thickness of the route indicates how frequently a road must be used to reach all customers.
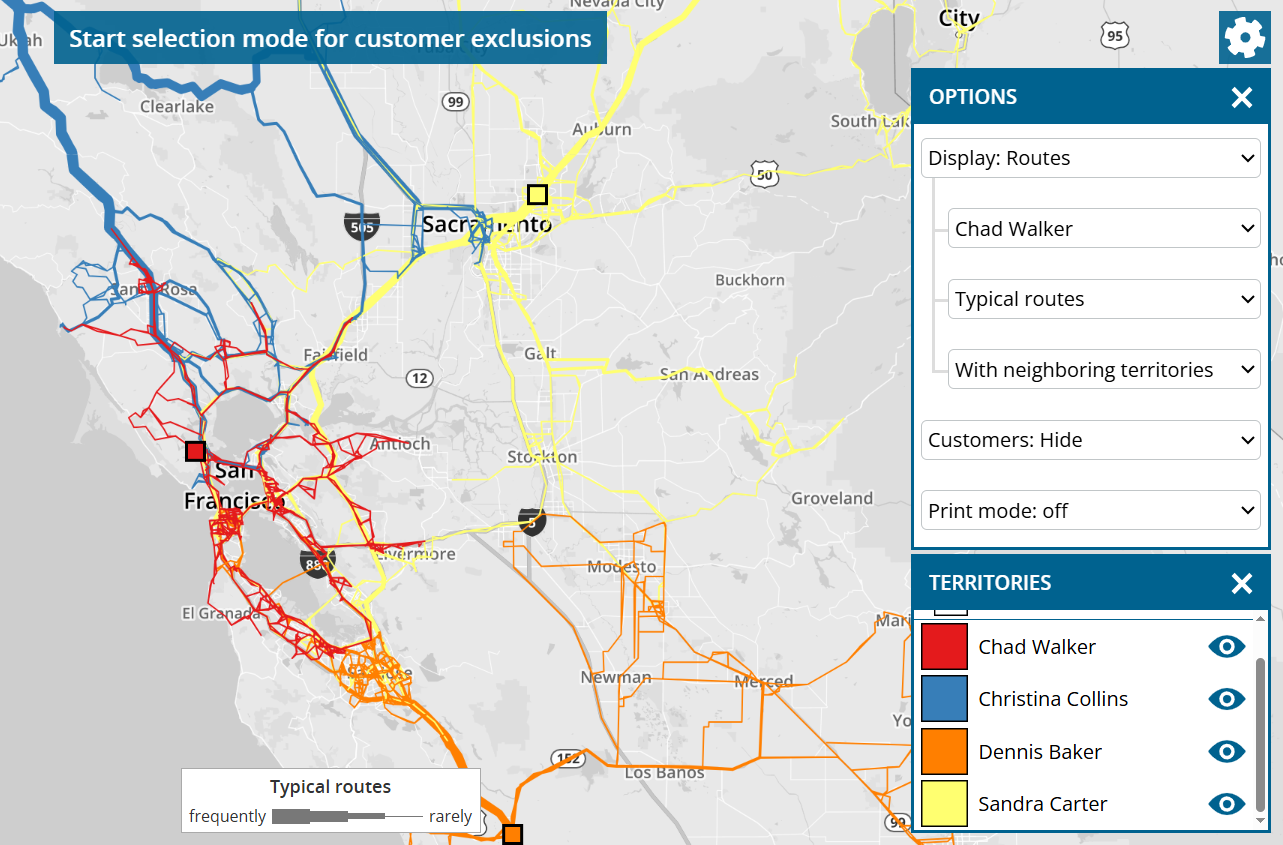
Typical routes
This display is similar to “Routes from home location”, whereby the routes between adjacent customers are also visualized.
This illustration provides a good insight into which roads the employee is likely to drive on and how often on his tours in order to visit his assigned customers in the desired call interval.
If you wish, you can switch to “With neighboring territories” to see any overlaps in routes between employees. These overlaps are an indicator that there is potential for optimization.


