True to the proverb: “a picture is worth a thousand words”, we have extended portatour® by two features for improved visualization of customers on the map.
Individual customer symbols
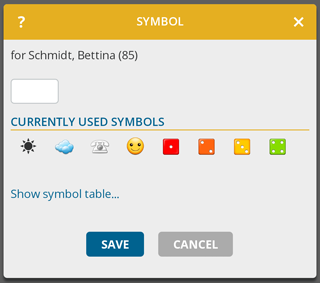
To better identify customers on the map, you assign meaningful symbols to your clients. This way you see at a glance, for example, the revenue potential of the customer or the industry.
To set the symbol, open the customer, click on the pencil above the address, and then click the new menu item “Symbol”. A text box will appear allowing you to enter any 1-2 characters. Click “Show symbol table…” for a choice of different symbols.
Tip: Enable the “Selection Mode” to select multiple customers. This option can be found below the customer list. Then click “Edit Selected” to set the same symbol for multiple customers.
Consequently, the client symbol appears not only on the map, but at all places in portatour® where the customer name is shown, for example in the schedule, in the customer list or in the portatour® report.
Technical background information: portatour® uses the Unicode character standard to display and store symbols. Unicode is also used for the “smileys” appearring at many places in the internet. The appearance of the symbols varies depending on the device, operating system, installed fonts and browsers.
Note for Outlook and Salesforce-users: Setting the symbol is also possible in Outlook and Salesforce. Go to the customer call settings of a customer, you find the symbol at the bottom.
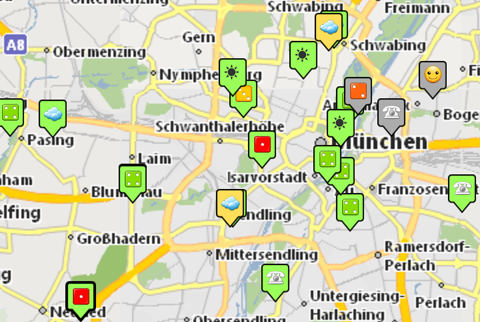
Color of a customer on the map
So far there was only one criterion for the coloring of the customers on the map: the current call urgency shown in the traffic-light colors red/yellow/green.
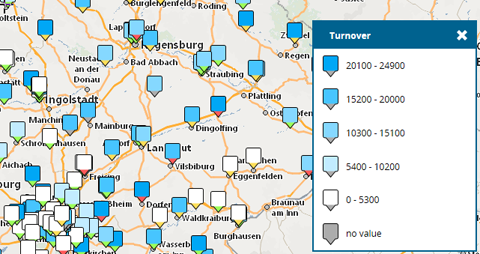
Now it becomes colorful: in the map view, click on option-symbol (“cogwheel”) and you can set the coloring yourself. Choose from both the built-in portatour® fields – call interval, call duration, etc. – as well as from custom fields that you can create yourself. For example, revenue or industry can be used.
portatour® automatically takes care of grouping and coloring on basis of the defined criterion. On the bottom-right of the map you will find the map legend icon. Click it to see the color mapping.
The call urgency of a customer is still visible: the lower part of the customer-marker on the map shows – as always – the urgency via a red / yellow / green color indicator.
We wish you a productive time using these new features and are looking forward to
your feedback, which you can send us to feedback@portatour.com .
P.S.: Users of portatour® for Outlook, Salesforce, Dynamics CRM or Connector must first install the latest version of portatour® to access the new functionality. Click the download-link or contact your administrator.