Have you always asked yourself which customers your field reps visit and where? Are you interested in visualizing your field reps’ call reports on a map and possibly analyzing them together with other key indicators? The new Power Map feature of Excel 2013 and Power Pivot for data analysis is able to create even complex visualizations. The following article will give you step-by-step instructions for the setup. For this purpose we use call reports entered into the portatour® field rep software which can be directly imported into Excel and updated at the push of a button.
What you need
- Your field reps’ call reports, e.g. from the portatour® route planner for field reps.
- Excel 2013 (or higher), Power Pivot and Power Map.
- A healthy amount of curiosity and creativity.
Example: Number of calls per year and state
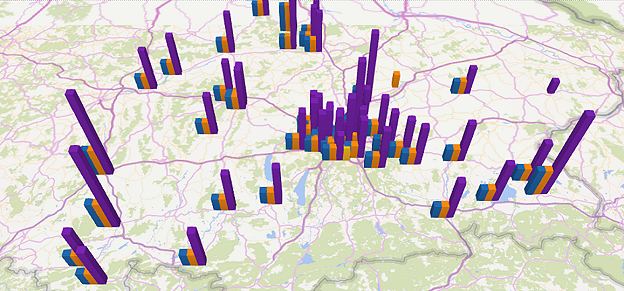
Below you can see a view of Power Map for Excel. The map shows the number of calls per state, comparing the years 2014 and 2013. We can see that the number of calls has increased in all areas between 2013 and 2014.
Setup: Excel, OData, Power Pivot and Power Map
The following 4 steps are a precondition for the creation of analyses.
1) Install Power Map, which is automatically available to subscribers of Office 365 ProPlus and Office 365 Enterprise E3. Follow the installation instructions for Power Map. In addition, you also need Power Pivot, which is also available for Excel 2013 and must be activated.
2) Your call reports are imported from the portatour® route planner. For this purpose an OData interface is provided, which enables Excel to import (and subsequently update) data directly from portatour®. Go to the menu item Options > Excel data analysis in portatour® Anywhere to obtain instructions for the setup (requires company access with 2+ users). Before you continue, make sure that your call reports are available in Power Pivot in Excel.
3) Now create your own statistical values in Power Pivot. If, for example, you want to calculate the number of calls per customer, add another column in your Power Pivot customer table and insert the following formula:
=COUNTROWS(RELATEDTABLE(Call Reports))
Hint: the “Relatedtable” feature only works if you have previously created relationships between the Power Pivot tables.
4) Now add the map by selecting Insert > Power Map > Map in Excel to start the data analysis on the map.
- Go to the top right below the heading “Choose geography” and select the following “Customer” fields with geopraphical data: State, Latitude, Longitude, Country, City, ZIP and Street.
- Underneath, link the respective meaning in Power Map with each selected field (e.g. “Street” with “Street”).
- To the left of each field you can see a circular button. Use it to select one of the visualization levels, e.g. “State” in order to classify the maps as shown in our example.
- Click “Continue”.
Now you have set up the map and you can visualize your data on it.
Analyze call reports
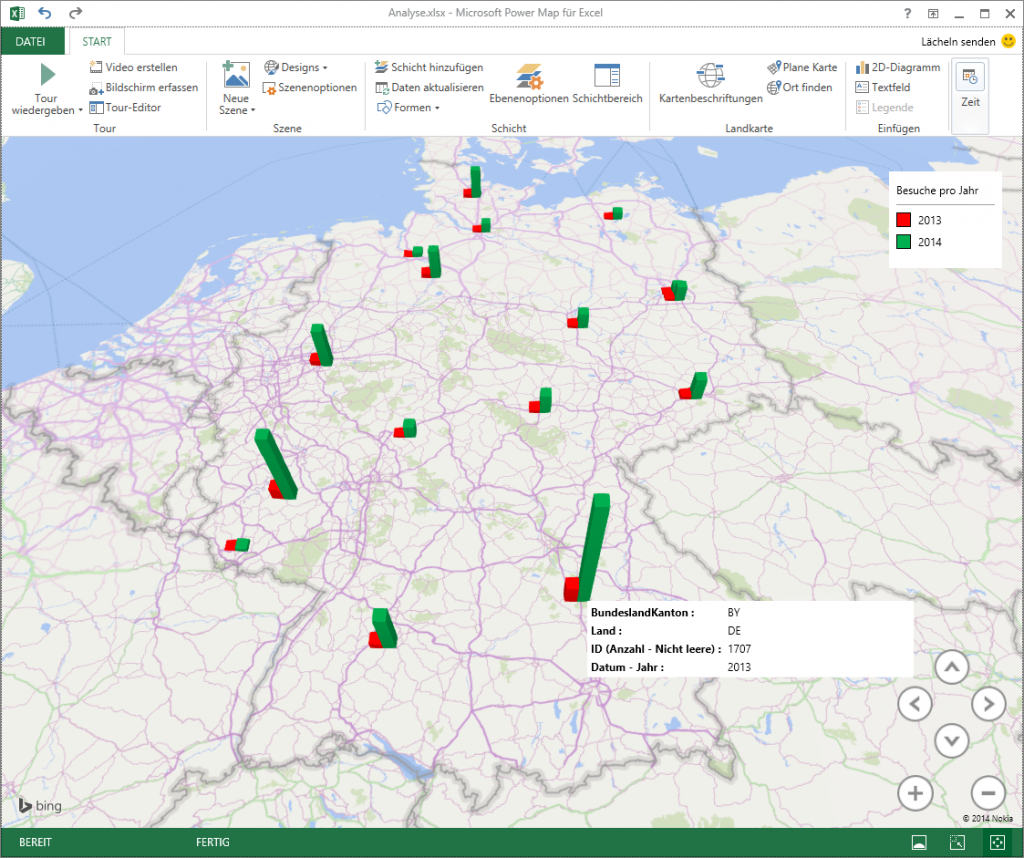
In order to visualize the number of calls per year on the map, drag the field Reports – ID into the box for height and the field Reports – Date – Year into the box for category. Finally, choose the the type of bar chart and change possible display options like colour and height. We already showed the result of the report, here it is again:
In order to visualize the average number of calls per customer select the chart type region. Then drag the previously created field Customers – number of calls into the box for height. Go to the value options and set the aggregation to average value. This results in the following report:
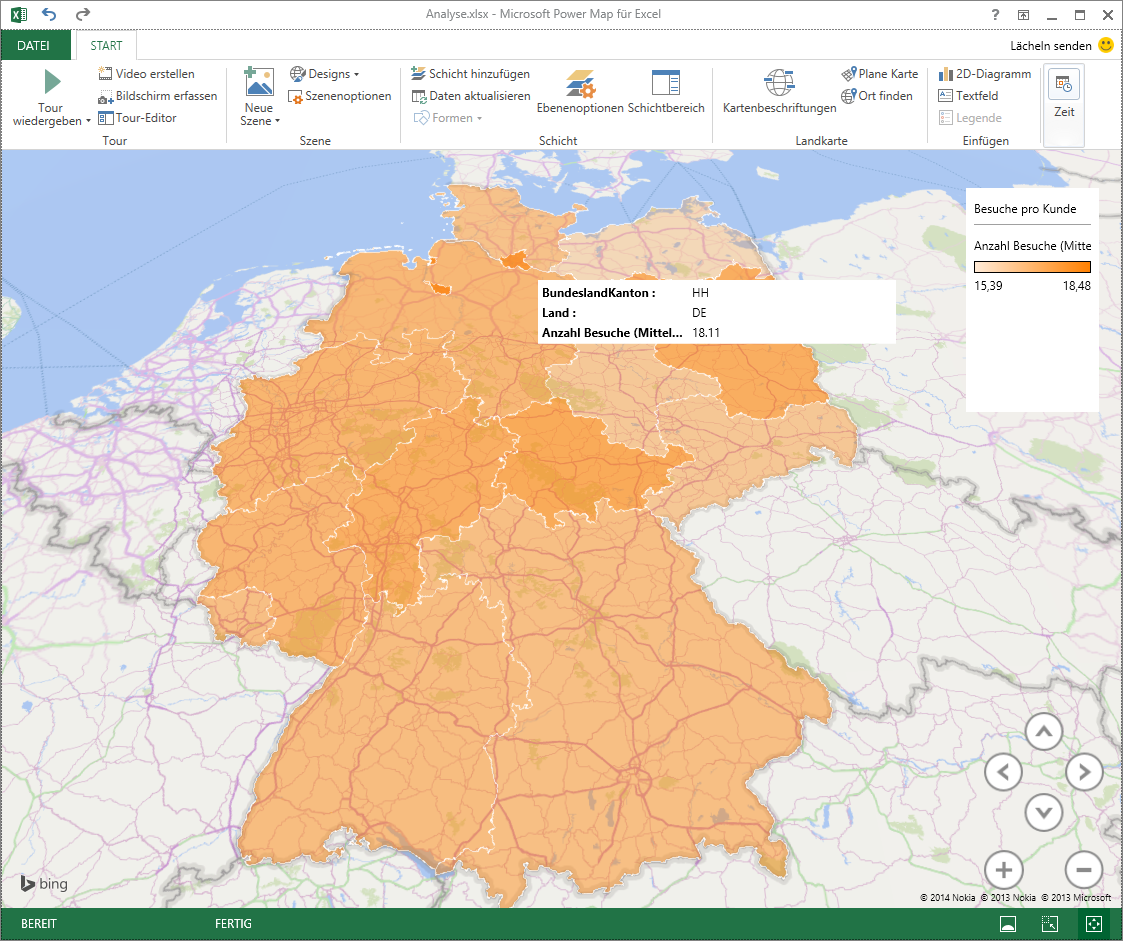
The map shows: more calls per customer are achieved in Berlin and Hamburg than in other federal states.
Many more analyzes possible …
You have all customer data and call reports available in Excel – use your curiosity and discover interesting values that you want to analyze and compare.
In case you do not yet use the portatour® route planning software register for a free trial.